The DataPortal comes with a variety of features that support you in your work.
Manage your entire fleet
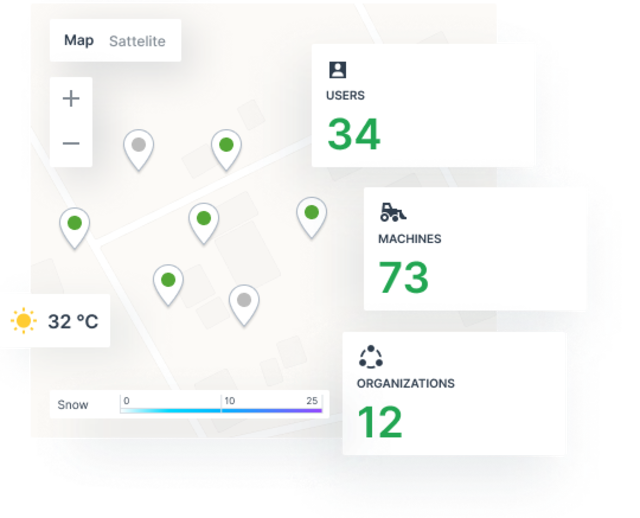
Dashboards give you and your customers a complete overview of your fleet and make it possible for you to take a closer look at individual machines.
Choose from a variety of widgets that you can drag and drop to create your custom views. Then, assign your dashboard to your fleet, a machine model, or an individual machine. For example, design a dashboard with only a few clicks and compare your fleet's fuel efficiency or inspect the performance metrics and current error codes of your excavator or any machine – the possibilities are endless.
The right view for every user
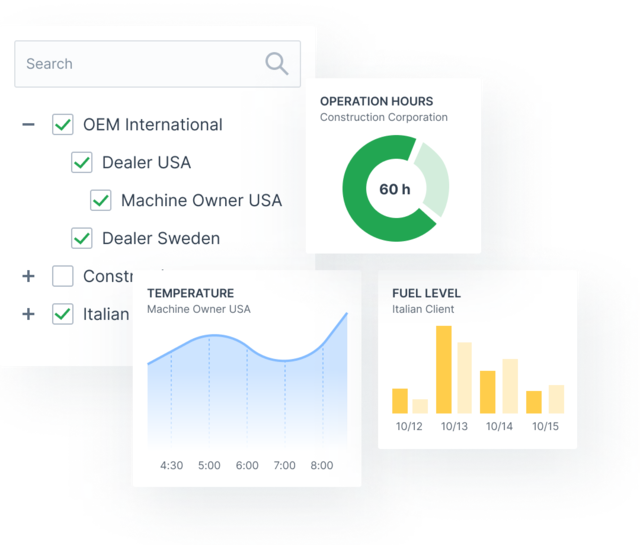
Define organization-specific dashboards and access permissions by using the org-tree feature. You can set up your complete organization hierarchy to set permissions to ensure each user or user group has access to its own data. For example:
- OEM - full data access for your organization
- Dealer - restricted data access to error codes only
- Machine Owner - fleet management data only
It has never been so easy to roll out a complete telematics solution and push your customer experience to the next level.
Paperless maintenance workflows
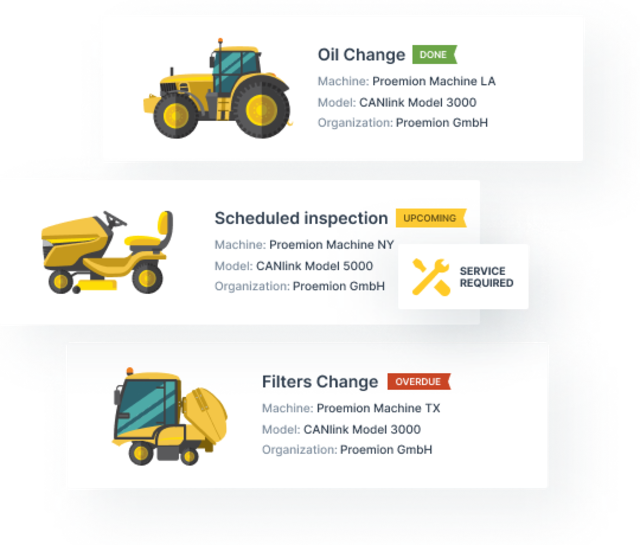
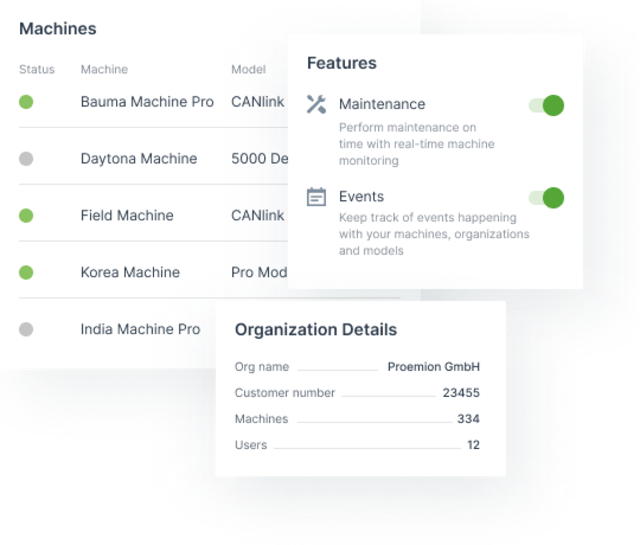
What is the maintenance status of my machines? Which machine needs service next? Does my customer adhere to the recommended service intervals and protocols? All this can be monitored and evaluated at a glance with the maintenance tasks feature.
Furthermore, all service tasks are kept in synchronization between the machine and the DataPortal automatically. Remote service or on-site workshop? We got you covered.
Make insightful decisions
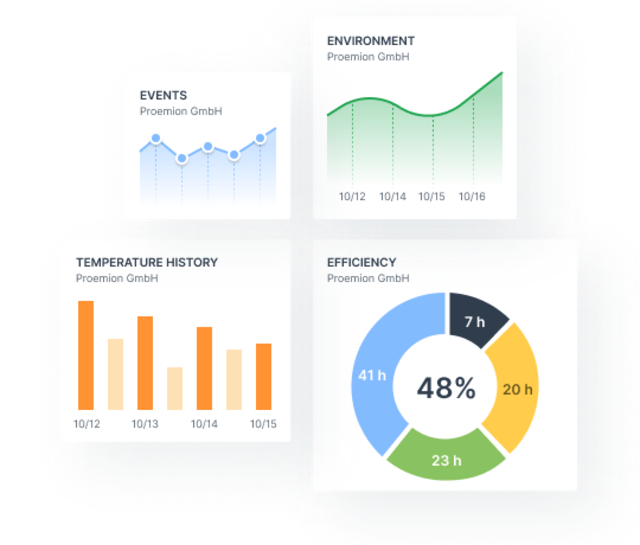
How high was the fuel consumption of my fleet in the last quarter? What was my fleet efficiency this week? How many operating hours did we spend on a specific construction site? Create powerful reports that answer all these questions in a few clicks.
Your custom look and feel
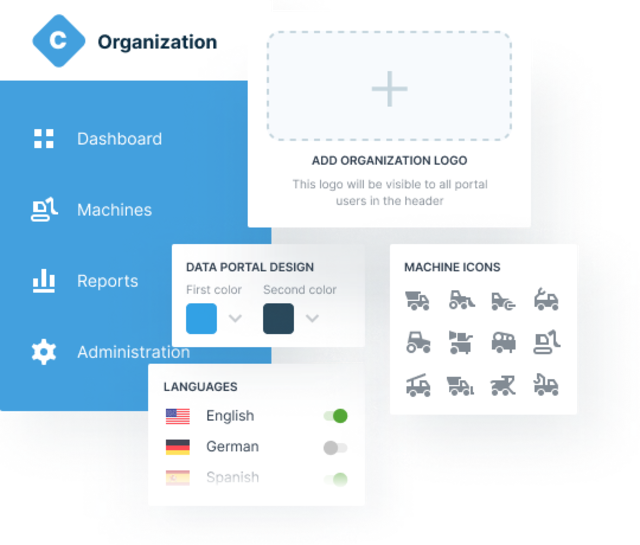
Simply adapt the appearance of the DataPortal to your brand. Blue instead of yellow? No problem! New logo? Exchanged in seconds!
Project reporting made easy
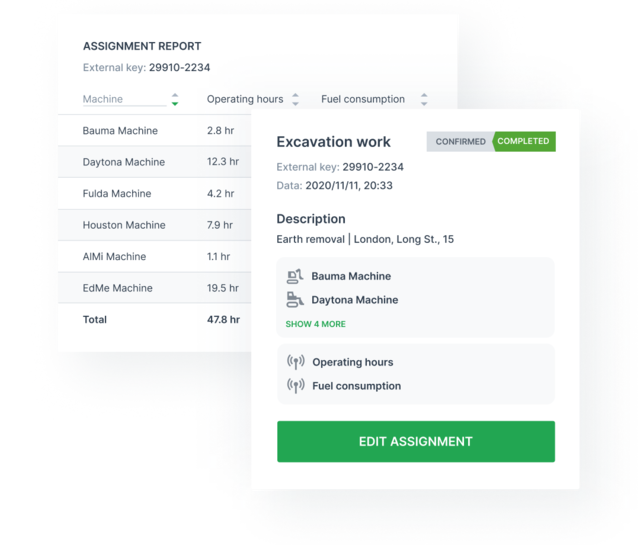
With the assignments feature, you can create and manage projects centrally in the DataPortal and generate usage-based reports. For each project, the machines assigned to the job, time frame, and details like fuel consumption and total operating hours can be defined and added to a report.
Usage-based reports can be used for post calculations, creating invoices, and forwarded as invoice attachments to the customer to show the invoice calculation, giving them more transparency into their costs and your services.
Smart alerts to act on
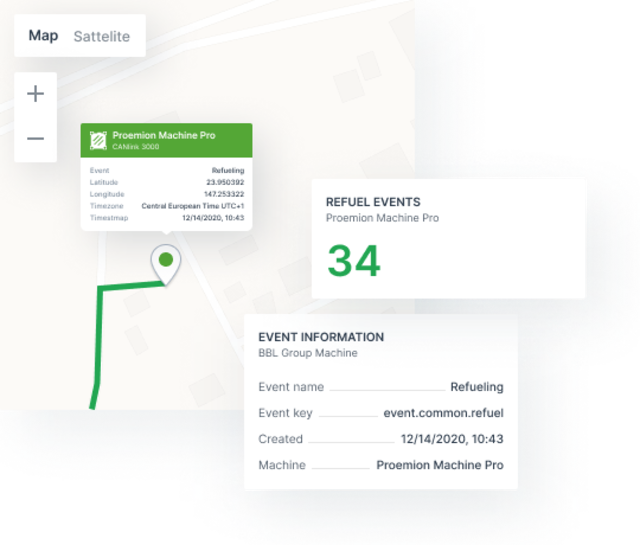
Keep a close eye on the status of your machines and be informed of any abnormalities. Is a machine outside of its GeoLeash? Were certain thresholds exceeded or not met? The event feature keeps you informed about the activities you choose to monitor.
Choose from many predefined smart event types such as time fences, fuel theft, or load detections or implement your custom own events.
An extra layer of supervision for your machines
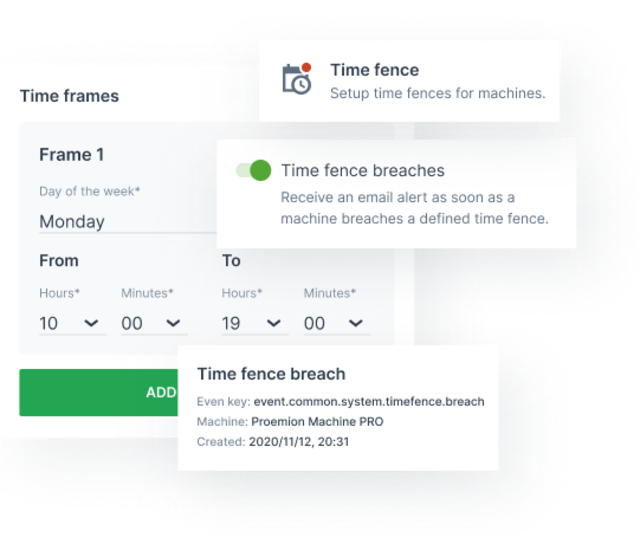
The time fence feature notifies you when a machine runs outside of a work schedule that you define (i.e., Monday - Friday, 10 AM to 7 PM). Time breaches are reported in realtime via email and as events in the DataPortal, alerting you to unusual activity or misuse.
Don't let your operations get stuck out in the cold
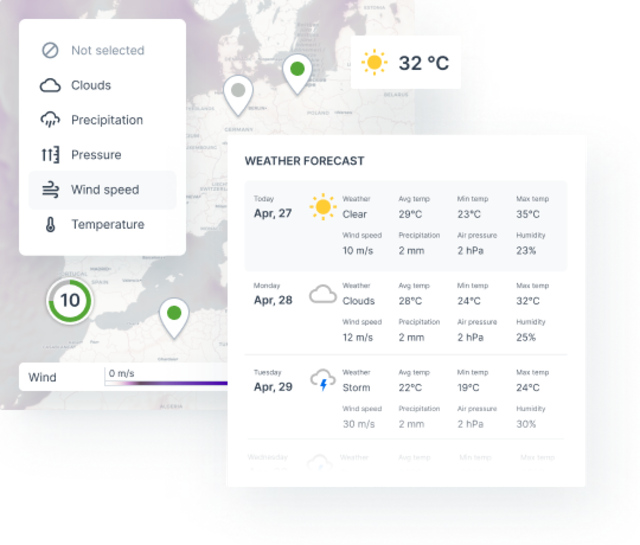
With the weather forecast and map overlay features, your machine locations' current and future weather conditions are provided in the DataPortal.
Machine owners who are weather dependent can be more productive when they take advantage of these resource planning features. Accurate weather information can help improve machine deployment and job scheduling.
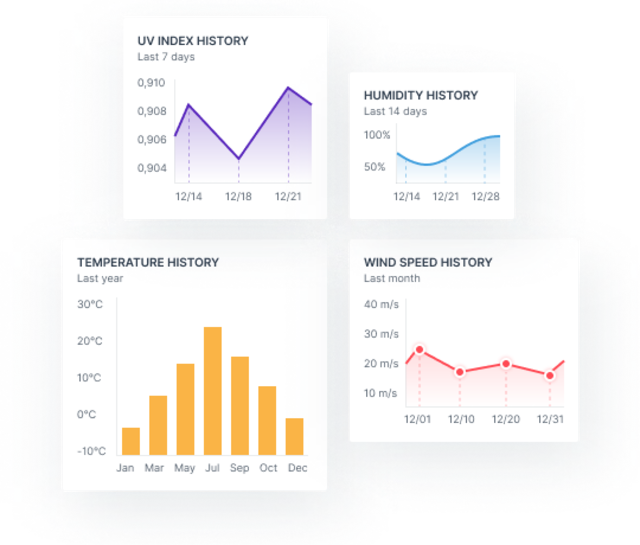
Collect weather information for insight into operations and performance
Obtaining access to weather archives or historical weather data can be expensive and difficult. With the optional historical weather reporting feature, you can record and analyze weather metrics for your machines, such as ambient temperature, humidity, wind speed, UV-index, and precipitation at any time. This gives you valuable insight into how weather conditions impact work results and machine performance.
Everything in safe hands
In the admin center, you can easily set up your organization tree, manage and assign all your machines, and adjust access rights that apply to them. To add new machines during your end of line test, use the automatic provisioning workflow.
You also have full user management access and can quickly invite new employees to the platform with a single click. User-based permissions ensure full control about access rights, and new features can be activated per organization level.

It's just better in your own language
The DataPortal supports multiple languages. Users can independently switch between languages in real-time and change their preferred language in their profile. Therefore, language barriers are no longer an obstacle when working with the portal.
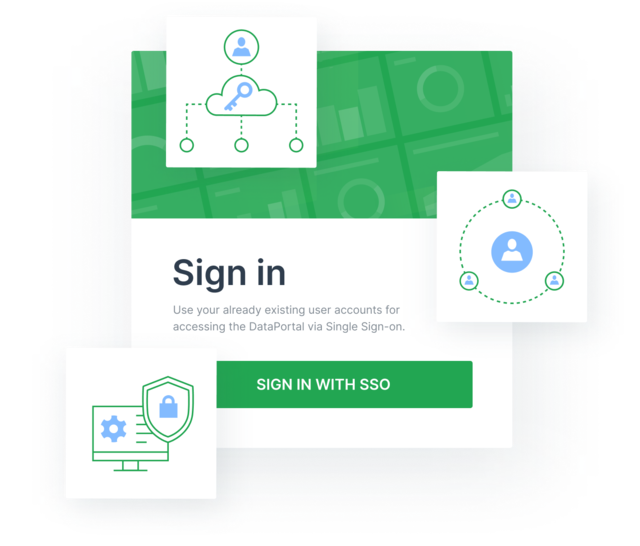
Consistent access management and easy user access with SSO
With Single Sign-On (SSO), you enable a single-click user experience for accessing the DataPortal.
Simplify your account management by using account credentials that are part of your company's identity provider, increasing your IT security, and saving employees' and customers' time.
The right feature for everyone to work effectively.
The DataPortal offers a variety of features to provide each user with the data they need to draw the right conclusions. This makes our DataPortal as individual as you are.
| Feature Name | Description | Availability |
|---|---|---|
| Dashboard | The configurable dashboard provides you with an overview of your machine fleet, data on an organizational level, and displays the required datasets and information. Depending on user permission sets, users can adjust the layout of the dashboard. | |
| Organization tree and permissions | Define access permissions and organization-specific dashboards by using the org-tree feature. You can set up your complete organization hierarchy to set permissions to ensure each user or user group can access the own data. | |
| Admin center | The administration menu offers you various setting options of the DataPortal: Here, you can edit the entire organization, assign authorizations, or even customize the look and feel of the DataPortal. | |
| Themes | Your custom look and feel: Adapt the appearance of the DataPortal to your brand. Blue instead of yellow? No problem! New logo? Exchanged in seconds! | |
| Multi-language | The DataPortal supports multiple languages. Users can independently switch between languages in realtime and can change their preferred language in their profile. |
| Feature Name | Description | Availability |
|---|---|---|
| Assignments | With the assignments functionality, you can create usage-based reports that track specified machine tasks or jobs for bookkeeping/service tracking purposes. | |
| Weather map overlays and forecast | Implement a weather-specific job scheduling and machine deployment into your business: With the weather forecast and map overlay features, the machine locations' current and future weather conditions are provided in the DataPortal. | |
| Machine tracking | Track the route and signal values of a machine for a specific time-frame. The machine route is represented as connected geo positions on a map. Signal values are displayed as graph data points that correspond to a geo marker on the map. | |
| Single Sign-On (SSO) | Use your existing partner and customer login solution with the DataPortal. This keeps account management compact, fulfills your IT-policies, and provides an excellent login experience for your employees, partners, and customers. |
| Feature Name | Description | Availability |
|---|---|---|
| Maintenance tasks | The maintenance tasks feature provides for tracking and planning machine service from the DataPortal. This feature's parameters have a high degree of variance, depending on the manufacturer's requirements and implementation. Dealers and machine owners can manage (view, change state) planned tasks. | |
| DTC notification | A DTC (diagnostic trouble code or error code) represents a faulty property in the machine system and enables to identify machine issues. The Proemion DataPortal features a daily email summary of machines with DTCs within the previous 24 hours (active and cleared errors). | |
| Machine actions | The machine actions function enables the user to transfer information entered into the DataPortal interface to the machine. This information can be numerical values (e.g., change a machine control parameter), status changes (e.g., change the machine mode), or string value. | |
| Two-way file transfer | The DataPortal features file transfer to and from the machine. You can also view the basic history of the transferred files. | |
| Efficiency report | Calculate and track the efficiency for individual machines, models, or your entire machine fleet with efficiency reporting. | |
| Threshold notification | Define thresholds of healthy signal values. The DataPortal features an email notification that is triggered when a signal value breaches a threshold. |
| Feature Name | Description | Availability |
|---|---|---|
| Reports | With our reports, different, individual evaluations and overviews can be created and compared. For example, create an overview of various machines' oil pressure and see if there is a connection to the engine temperature. | |
| Historical weather reporting | Record and analyze weather metrics for your machines with the optional historical weather reporting feature. This gives you additional insights into how weather conditions impact your work results and machine performance. |
| Feature Name | Description | Availability |
|---|---|---|
| Time fence | The time fence feature allows you to define a schedule for when a machine should be allowed to be in use. If a time breach event is registered, an immediate email notification to the users subscribed will be sent. | |
| GeoLeash | Define a location-independent operating radius for your machines and receive automatic notifications about machine relocations. |